

Effect of roughness on mean flow properties for turbulent boundary layer
 |
 |
 |
| Takatsugu KAMEDA Kindai University |
Shinsuke MOCHIZUKI Yamaguchi University |
Hideo OSAKA Yamaguchi University |
We were awarded the 2017 JSME paper award. We are very grateful to relate people and the committee of JSME for the award. We will introduce a part of the above title’s paper. The contents are the analytical approach in a roughness sublayer flow and the dependency of the roughness function to a roughness pitch ratio.
Figure 1 shows the flow field over a rough surface. The origin of the Cartesian coordinate system is at the leading edge of the rough surface. The streamwise distance,![]() , is measured from the leading edge, and the wall-normal distance,
, is measured from the leading edge, and the wall-normal distance,![]() , is measured from the roughness crest.
, is measured from the roughness crest. ![]() is the wall-normal distance measured from the centroid of the distributed drag. The distance between the centroid and the roughness crest is referred to as the displacement height,
is the wall-normal distance measured from the centroid of the distributed drag. The distance between the centroid and the roughness crest is referred to as the displacement height,![]() .The rough surface consists of square ribs, and the roughness height,
.The rough surface consists of square ribs, and the roughness height,![]() , varies linearly, which is
, varies linearly, which is ![]() =0.00125, which is one of the self-preserving conditions proposed by Rotta (1962) and Talluru et al. (2016). The roughness pitch ratio,
=0.00125, which is one of the self-preserving conditions proposed by Rotta (1962) and Talluru et al. (2016). The roughness pitch ratio,![]() , is 4. For the flow over a rough surface with
, is 4. For the flow over a rough surface with ![]() =4, the viscous drag is negligible to the drag acting on the rough surface (Kameda et al.,2007, Leonardi et al., 2003). The measurement within the roughness sublayer was performed in the range of one roughness pitch length near
=4, the viscous drag is negligible to the drag acting on the rough surface (Kameda et al.,2007, Leonardi et al., 2003). The measurement within the roughness sublayer was performed in the range of one roughness pitch length near ![]() = 2,180 mm. At this position, the Reynolds number,
= 2,180 mm. At this position, the Reynolds number,![]() , based on the momentum thickness,
, based on the momentum thickness,![]() , was 6,000 and the roughness Reynolds number,
, was 6,000 and the roughness Reynolds number, ![]() where
where ![]() is the friction velocity, 149. The velocity measurement was made with LDV (TSI IMF750), which was run in back scatter. The one-dimensional velocity measurement principle was adopted to estimate the first and second moments of fluctuating velocities near the rough surface.
is the friction velocity, 149. The velocity measurement was made with LDV (TSI IMF750), which was run in back scatter. The one-dimensional velocity measurement principle was adopted to estimate the first and second moments of fluctuating velocities near the rough surface.
The spatially-averaged Reynolds equation in the cavity is written as
(1) |
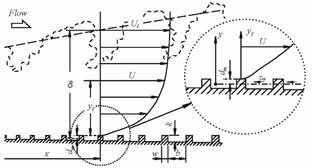
Fig. 1 Flow field, nomenclature and symbols.
where ![]() is defined by
is defined by
(2) |
![]() and
and ![]() are the deviations of the streamwise and wall-normal mean velocities from the spatially-averaged mean velocities with respect to the cavity width. The total shear stress,
are the deviations of the streamwise and wall-normal mean velocities from the spatially-averaged mean velocities with respect to the cavity width. The total shear stress,![]() , is given as the sum of the dispersive stress,
, is given as the sum of the dispersive stress, ![]() =
=![]() , the Reynolds shear stress,
, the Reynolds shear stress, ![]() =
=![]() , and the viscous stress,
, and the viscous stress, ![]() =
=![]() . In the present rough surface flow, the total shear stress is approximately equal to the Reynolds shear stress. By applying the mixing length model and the similarity of the mean velocity profile,
. In the present rough surface flow, the total shear stress is approximately equal to the Reynolds shear stress. By applying the mixing length model and the similarity of the mean velocity profile,![]() , to Eq.(1), the solution is written as
, to Eq.(1), the solution is written as
(3) |
From our experimental data, the coefficients, ![]() through
through![]() , are
, are ![]() 10.3,
10.3, ![]() 6.60,
6.60, ![]() 0.51, and
0.51, and ![]() -3.04. In Eq.(3),
-3.04. In Eq.(3), ![]() is the velocity scale, Eq.(4), defined from the pressure drag,
is the velocity scale, Eq.(4), defined from the pressure drag, ![]() , per spanwise length and
, per spanwise length and![]() is the cavity width.
is the cavity width.
(4) |
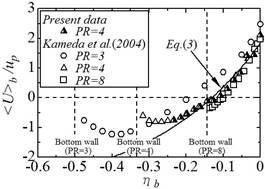
Fig.2 Spatially-averaged streamwise mean velocity profiles.
 |
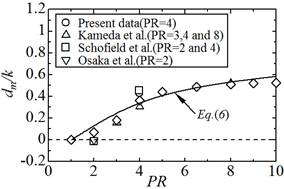 |
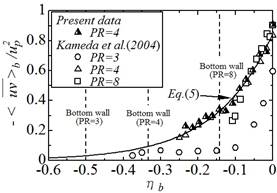
| Fig.3 Spatially-averaged Reynolds shear stress profiles. | Fig.4 Displacement height. |
Figure 2 gives the spatially-averaged streamwise mean velocity profiles. The non-dimensional profiles,![]() are almost similar except for the bottom region in the cavity in the range of 4
are almost similar except for the bottom region in the cavity in the range of 4![]() 8, and well consistent with Eq.(3). The spatially-averaged Reynolds shear stress and the displacement height,
8, and well consistent with Eq.(3). The spatially-averaged Reynolds shear stress and the displacement height,![]() , can be represented as the following equations by use of the solution, Eq.(3).
, can be represented as the following equations by use of the solution, Eq.(3).
(5) |
|
|
(6) |
In Eqs.(5) and (6), the coefficient is ![]() 0.301. As shown in Figures 3 and 4, the equations (5) and (6) well agree with the experimental and DNS data.
0.301. As shown in Figures 3 and 4, the equations (5) and (6) well agree with the experimental and DNS data.
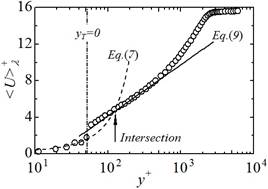
The roughness function on the logarithmic sublayer can be discussed based on the connection of the streamwise mean velocity profiles of roughness and logarithmic sublayers. Equation (3) is rewritten by Eq.(7) with the operation of averaging per one roughness pitch length, ![]() .
.
(7) |
![]() is non-dimensional height,
is non-dimensional height, ![]() . The spatial average,
. The spatial average, ![]() , is defined as
, is defined as
within a cavity. |
(8) |
The classical log law profile, Eq.(9), will be applied as the spatially-averaged streamwise mean velocity profile over the roughness sublayer.
(9) |
Now, it is assumed that two equations (7) and (9) are intersected at![]() . Here, we will define the height of
. Here, we will define the height of ![]() as the roughness sublayer thickness,
as the roughness sublayer thickness,![]() . The roughness function can be represented as
. The roughness function can be represented as
(10) |
|
|
(11) |
 |
 |
| Fig. 5 Logarithmic mean velocity profile. | Fig.6 Constant of roughness function. |
The coefficient ![]() is determined from our experimental data (See, Fig. 5) and is
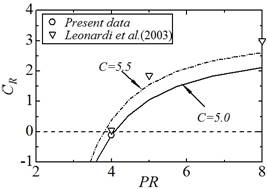
is determined from our experimental data (See, Fig. 5) and is ![]() 0.08. Figure 6 shows the variation of
0.08. Figure 6 shows the variation of ![]() to
to ![]() . The present experimental and DNS (Leonardi et al., 2003) data are included in this figure. The solid and dotted lines are the Eqs.(10) and (11) with
. The present experimental and DNS (Leonardi et al., 2003) data are included in this figure. The solid and dotted lines are the Eqs.(10) and (11) with ![]() =5.0 in the present experimental data and
=5.0 in the present experimental data and ![]() =5.5 in the DNS data. The present experimental and DNS data are well represented with the solid and dotted lines. According to our consideration, the roughness function can be determined by the roughness sublayer thickness and the spatially-averaged streamwise mean velocity profile within the roughness sublayer.
=5.5 in the DNS data. The present experimental and DNS data are well represented with the solid and dotted lines. According to our consideration, the roughness function can be determined by the roughness sublayer thickness and the spatially-averaged streamwise mean velocity profile within the roughness sublayer.
References
Kameda, T., Mochizuki, S. and Osaka,H., Investigation of the level of action on wall shear stress and the law of the wall for rough wall turbulent boundary layer, Transactions of the Japan Society of Mechanical Engineers, Series B, Vol.73, No.733(2007), pp.1821-1828(in Japanese).
Kameda, T., Osaka, H. and Mochizuki, S., Effect of roughness pitch ratio on the structures in the vicinity of a roughness element for the turbulent boundary layer developing over k-type rough walls arranged with two-dimensional square ribs, Transactions of the Japan Society of Mechanical Engineers, Series B, Vol.70, No.697(2004), pp. 2303-2310(in Japanese).
Leonardi S., Orlandi P., Smally R.J., Djenidi L. and Antonia R.A., Direct numerical simulations of turbulent channel flow with transverse square bars on one wall, Journal of Fluid Mechanics, Vol.491(2003), pp.229-238.
Osaka, H., Sakamoto, M. and Kageyama, Y., Turbulent structures in the vicinity of the roughness element for a boundary layer over a d-type rough surface, Transactions of the Japan Society of Mechanical Engineers, Series B, Vol.52, No.478(1986), pp.2360-2366(in Japanese).
Rotta, J.C., Turbulent boundary layers in incompressible flow, Progress in Aerospace Sciences. Vol.2(1962), pp.96-129, Elsevier Ltd.
Schofield, W.H., Perry, A.E. and Joubert, P. N., Similarity relations for pressure distributions on slot type rough walls under turbulent boundary layers, Transactions of ASME, Journal of Fluid Engineering, Vol.96, No.2(1974), pp.186 -188.
Talluru, K.M., Djenidi, L., Kamruzzaman, Md. and Antonia, R.A., Self-preservation in a zero pressure gradient rough-wall turbulent boundary layer, Journal of Fluid Mechanics, Vol.788(2016),pp. 57-69.
Key words
Turbulent Boundary Layer, Roughness Sublayer, Roughness Function