Bayesian optimization of traveling wave-like wall deformation for friction drag reduction in turbulent channel flow
 Yusuke NABAE Tokyo University of Science  Koji FUKAGATA Keio University |
Abstract
In the present study, we attempt to optimize the control parameters of streamwise traveling wave-like wall deformation (Fig. 1) for friction drag reduction in a turbulent channel flow by using Bayesian optimization based on stochastic processes.
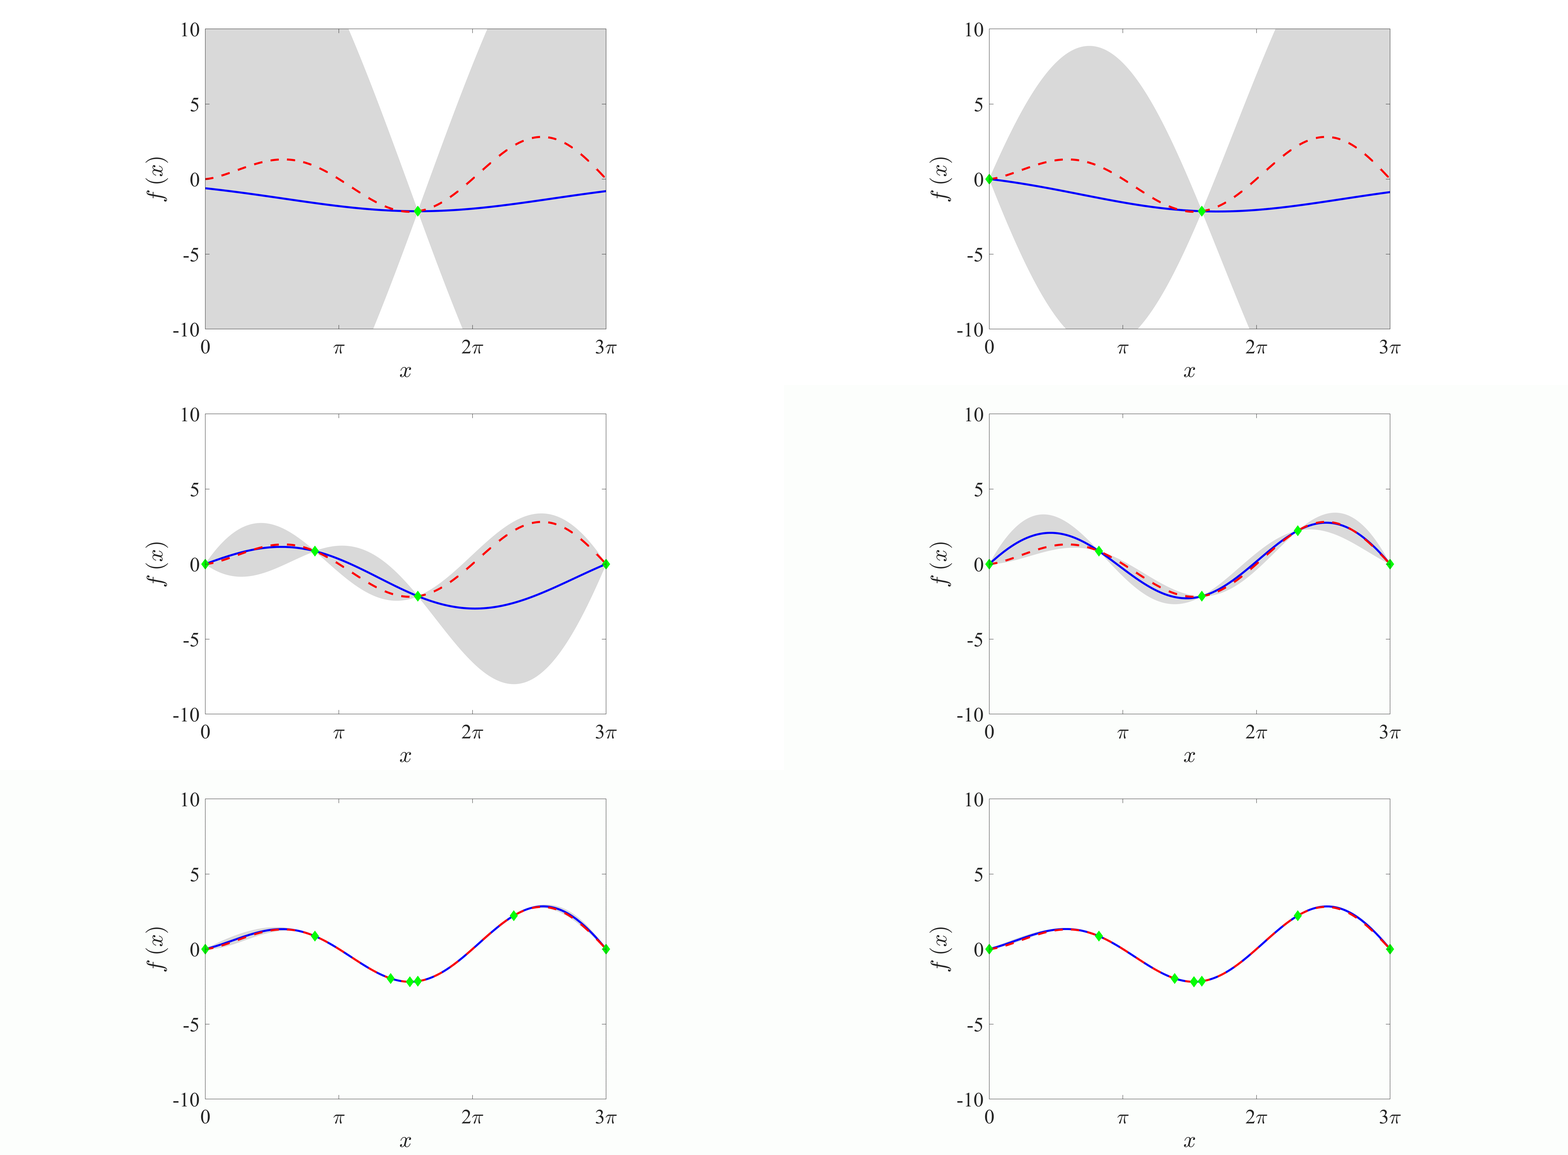
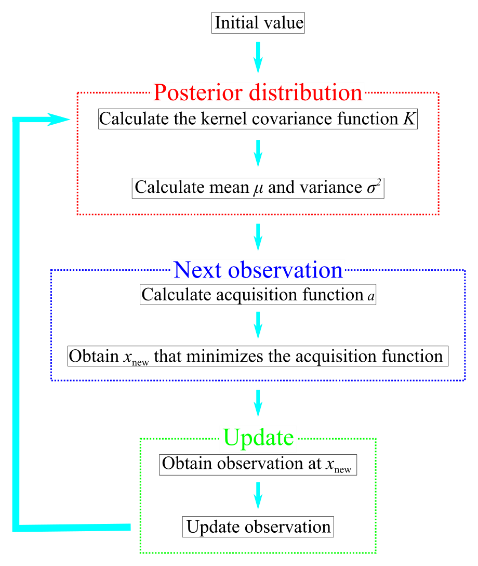
It is well-known that this optimization method is good at finding the parameter values to minimize (or maximize) an expensive cost function or a blackbox function. Figure 2 shows a schematic chart and the flowchart of the Bayesian optimization. The Bayesian optimization consists of three different steps: (i) calculating the posterior distribution, (ii) determining the next observation, and (iii) updating the observations. In the present study, we utilize GP-LCB (Gaussian Process-Lower Confidence Bound) function as the acquisition function, which is required to determine the next observation.
Figure 3 shows the mean and the update history of the maximum value of the drag reduction rate RD after 12 updates. In this study, we optimize two different control parameters: the velocity amplitude vw and the phasespeed c of wall-deformation. The maximum drag reduction rate is 60.5%, which is much larger than that obtained by the parametric study (Nabae et al., Int. J. Heat Fluid Flow, 2020). In this optimized case where the bulk-mean velocity varies periodically, the following cycle is repeated, so that the substantial drag reduction effect is maintained: (1) laminarization of the flow field, (2) occurrence of an inflection instability due to the flow reversal in the region near the wall, and (3) re-transition to the turbulent flow.
The present results suggest that an additional fine-tuning of control parameters using an advanced optimization method is of significant importance to maximize the control performance.
Keywords
Drag reduction, Turbulent channel flow, Traveling wave, Wall deformation, Bayesian optimization
Figures

Fig. 1: Schematic of streamwise traveling wave-like wall deformation.
 |
 |
| (a) | (b) |
| Fig. 2: (a) Schematic chart and (b) flowchart of the Bayesian optimization. In (a), the horizontal axis is the variable x, and the vertical axis is the observation value f(x). Blue line, posterior distribution; gray area, 95% confidence bound; red dashed line, true function; green point, observations. | |

Fig. 3: (a) The mean after 12 updates. (b) The update history of the maximum value of the drag reduction rate RD. In (a), circle, square, and cross denote the initial points, the observation points, and the best point, respectively.

