Newsletter 2013.4 Index
Theme : "Fluids Engineering for the World’s Top Technologies"
| Back | |
Detailed Numerical Study on Turbulent Primary Atomization and Vapor Mixing of a Fuel Spray
Junji SHINJO |
Abstract
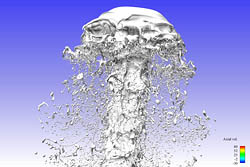
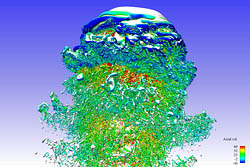
Detailed numerical simulation based on level-set interface capturing is used to investigate the spray formation dynamics which is critical to spray combustion performance in liquid fuel engines. The liquid primary atomization region has not been understood well so far, but this region strongly determines the downstream spray combustion. Thus, the present study aims to elucidate the formation mechanisms and the relevant characteristics. To resolve the local curvature of ligaments and droplets, very fine grid systems up to 6 billion points are used here. This is one of the largest computations ever in this field. The initial impact of liquid against the quiescent gas creates an umbrella-like head shape and liquid atomization first occurs from this umbrella edge (Fig.1). A recirculation zone is formed behind the head and periodic vortex shedding at the head edge determines the spatially non-uniform droplet number density distribution. The droplet size is affected by the injection conditions and the droplets are generated at Weber number~O(1). The fuel/air mixing characteristics can be strongly influenced by the droplet number density distribution and the local flow field structure. Since turbulence is generated by the liquid atomization dynamics, the local velocity field is typically fluctuating and unsteady. Fuel vapor clustering is observed for some high number density regions, but not for some low number density regions (Fig.2). The later combustion (ignition) will occur as a result of these complex interactions. It is important to extend the current method to a larger scale, and a modeling effort should be sought as well so that the entire combustor-scale simulations could be done with higher accuracy.
Key words
Detailed numerical simulation, Primary atomization, Fuel vapor mixing


Fig. 1 Spray shape (left) and turbulent eddies (right). The color indicates the axial velocity.

Fig. 2 Fuel vapor distribution (mass fraction)


