Newsletter 2019.3 Index
Theme : "Mechanical Engineering Congress, 2019 Japan (MECJ-19)”
|
Fluid-engineering characteristics of bubbles, and measurement technologies for them
Takayuki SAITO
Professor emeritus,
Shizuoka University
Abstract
This article is a digest of the keynote lecture by the author at JSME annual meeting held at Akita University on September 8-11, 2019. This article focuses on the measurement technologies which were skipped at the lecture due to the limitation of time. To measure the motion of bubbles and bubbly flows, two categories of measurement technologies based on different principles are required: field-wise measurement and point-wise measurement. A typical example of the former is visualization, and electric resistance or optical fiber probing is the one of the latter. In order to realize simultaneous measurement of mass transfer between a bubble and the surrounding liquid, the bubble size and shape, the surrounding liquid motion, and the gravity-center and surface motion of the bubble, a measurement technology of Laser Induced Fluorescence (LIF) is described as well as optical fiber probing that is developed independently by the author and his group.
Key words
Bubble, Multiphase flow, Measurement, LIF, PIV, Optcal fiber, Ray trace
Figures

(a) Primary pressure controller, (b) Secondary pressure controller, (c) Audio speaker, (d) Function generator, (e) Amplifier, (f) Hypodermic needle, (g) Gas cylinder
Fig. 1 Single bubble launch device.

Fig. 2 Typical LIF results of a single CO2 bubble.

Fig. 3 Series equidistant cross-section images of bubble wakes from y-z plane.

Fig. 4 Construction of the 3D bubble wakes.
 |
 |
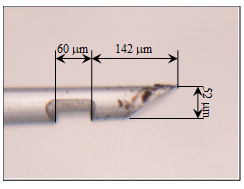 |
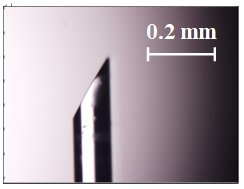
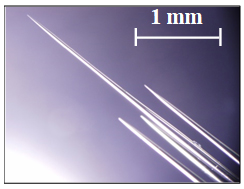
| (a) Single-tip optical fiber probe (S-TOP). | (b) Four-tip optical fiber probe (F-TOP). | (c) Single-tip optical fiber probe Micro-fabricated by femto-second laser pulses (FS-TOP). (Saito et al., 2009). |
Fig. 5 Several types of the optical fiber probe.

Fig. 6 A typical configuration of the S-TOP system.

(a) Photomultiplier covered with electromagnetic shield, (b) Polarizer, (c)
LD, (d) Beam splitter, (e) Objective lens, (f) S-TOP covered with a protective tube,
(g) Precision optical stage Fig. 7 A typical configuration of optics.
Fig. 7 A typical configuration of optics.
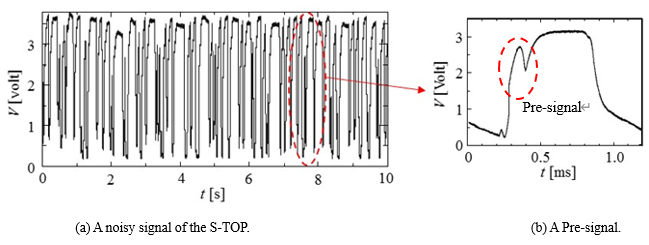
Fig. 8 A typical output signal of the S-TOP.

Fig. 9 Differences between output signals of the wedge-shaped S-TOP and cylindrical-tip optical fiber probe.
 |
 |
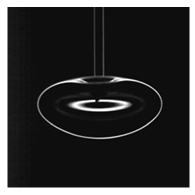 |
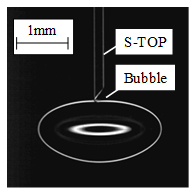
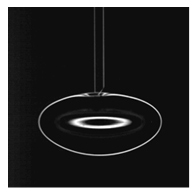
| (a) S-TOP touches on the bubble. | (b) S-TOP starts to pierce the frontal surface. | (c) S-TOP tip is in the bubble. |
Fig. 10 Deformation of the frontal surface of the bubble. (Mizushima and Saito, 2012)

