Newsletter 2023.3 Index
Theme : "The Conference of Fluid Engineering Division (March issue)"
|
Optimization of a Francis Turbine Runner by Means of Inverse Design and CFD Calculation
 |
Shunsuke Nagata ,
|
Abstract
A Francis turbine runner was optimized using a combination of the 3D Inverse Design Method and Computational Fluid Dynamics (CFD). An experiment of the directly optimized conventional turbine (Fig 1) confirms the validation of CFD calculation. Fig 2 shows the design optimization flow. First, a new meridional shape was designed by Design of Experiments with CFD and the database of meridional shape factors. Then, angular momentum at the runner inlet was corrected to cover the effects of the boundary layer from runner upstream domains such as stay vanes and guide vanes. Combining the Inverse method and the Genetic Algorithm (GA), blade loading distribution and stacking conditions were optimized to improve the runner performance. Fig 3 shows the convergence history of RV optimization by GA. The loss evaluation and internal flow investigation on runners show that the front loading at the crown side, the after loading at the band side, and a positive blade lean angle, which is band side forward inclination in the direction of rotation, at the runner inlet are valid to reduce the pressure gradient and minimize the secondary flow from the crown to the band (Fig 4).
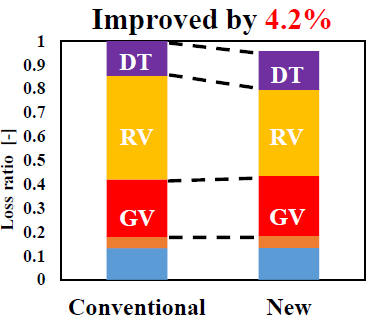
Considering the above discussion, a new runner was designed by the Inverse method. The full-domain CFD calculation confirms that the total loss of the new turbine at the design point is 4.2 [%] lower than that of the conventional one as shown in Fig 5. This result shows the 3D Inverse Design Method is practical for controlling the secondary flow in the Francis turbine runners and optimizing the shape. Also, this optimization method reduced the number of CFD calculations drastically. It enables the designers to improve the turbine performance at a low cost in a short time.
Key words
3D Inverse Design Method, Francis turbine, Optimization, Computational Fluid Dynamics (CFD)
Figures

Fig. 1 Test appartus at Waseda University.

Fig.2 Design flow.

Fig.3 Convergence history of the RV optimization by Genetic Algorithm.

Fig.4 Comparison of Internal flow (CFD result).

Fig.5 Comparison of Internal flow (CFD result).

