Newsletter 2016.11 Index
Theme : "Mechanical Engineering Congress, 2016 Japan (MECJ-16)"
|
Characteristics of Non-equilibrium Grid Turbulence and Scalar Transfer Mechanism
Yasuhiko Sakai,
|
Abstract
In this report, two topics are presented. One is the effects of grid geometry on dissipation and non-equilibrium turbulence, and another is an implicit large eddy simulation of a scalar mixing layer in fractal grid turbulence.
As for the first topic, a total 11 grids in four families, including single- and multi-scale grids (Fig. 1(b)), are tested to investigate the development and decay characteristics of grid-generated turbulence. Special attention has been paid to dissipation and non-equilibrium characteristics in the decay region. It is shown that the combination of a large square grid and inhomogeneously arranged smaller grids produces an elongated non-equilibrium region (Fig. 2). In the second topic, we show the simulation results of a scalar mixing layer in fractal grid turbulence by the implicit large eddy simulation (ILES) using low-pass filtering as an implicit subgrid-scale model. The square-type fractal grid with three fractal iterations (N = 3) is used for generating turbulence. Near the fractal grid, the scalar mixing layer rapidly develops just behind the largest grid bars owing to the vertical turbulent transport (Fig. 3). The scalar mixing layer near the fractal grid also develops outside the largest grid bars because the scalar is transported between the outside and back of the largest grid bars by the spanwise turbulent transport (Fig. 4(a), (b)). In the downstream region, the scalar mixing layer develops more rapidly near the grid centerline by the vertical turbulent transport and by the spanwise one which transports the scalar between the back of the largest grid bars and both the centerline and outer edge of the fractal grid (Fig. 4(c), (d)). Then, the mean scalar profile becomes close to be homogeneous in the spanwise direction.
Key words
Turblence, Dissipation, Non-equilibrium region, Transport, Scalar mixing
Figures
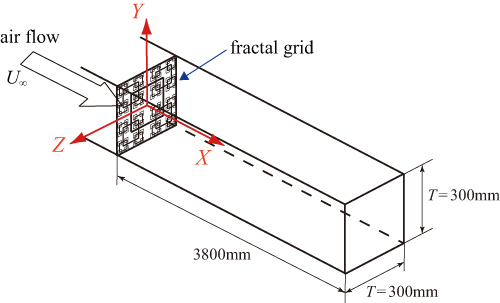
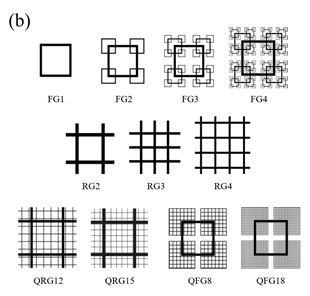
Fig.1 (a) Test section of wind tunnel and (b)test grids
| (a) | 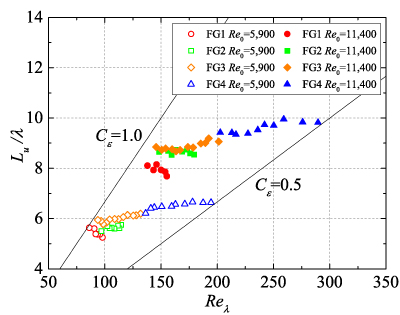 |
| (b) | 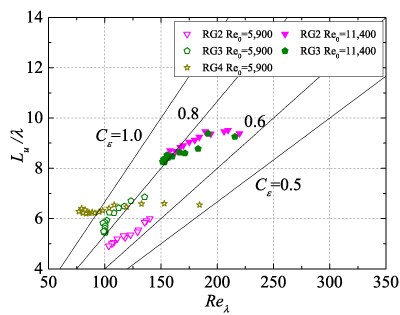 |
| (c) | 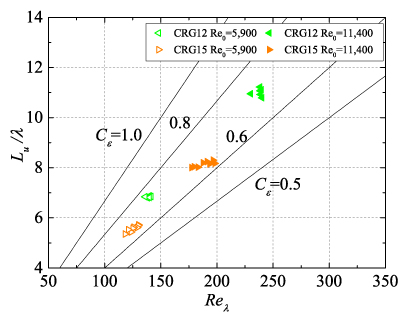 |
| (d) | 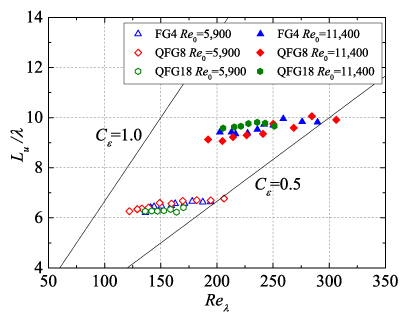 |
Fig.2 Lu/λ vs Reλ (a)FGs, (b)RGs, (c)CRGs, (d)FG4 and QFG

Fig.3 Three dimensional visualization of a scalar mixing layer. The isosurface of ϕ=0.5 is shown with a color which represents vertical scalar flux νϕ. The isosurface of second invariant of the resolved velocity gradient tensor (Q>0) is shown by blue.

Fig.4 Cross-sectional profiles of turbulent diffusion term
| (a) vertical direction | Tx =-∂<ν'ϕ'>/∂y at x/L0=1.8 ; |
| (b) horizontal direction | Tz =-∂<w'ϕ'>/∂z at x/L0=1.8 ; |
| (c) vertical direction | Tx =-∂<ν'ϕ'>/∂y at x/L0=3.6 ; |
| (d) horizontal direction | Tz =-∂<w'ϕ'>/∂z at x/L0=3.6 ; |


